Data Designer: Modeling the Firm Data Submission Framework
Financial and regulatory bodies, such as the EBA , IFRS and CEN/WS XBRL, are using data point modeling as a methodology for modeling financial and risk data submissions. The following describes part of a data point implementation to model the Firm Data Submission Framework (FDSF).
 |
| Figure 1: Data model elements are directly reflected in Data Designer |
- Contexts are used to define tables of data that consist of Measures grouped by various Dimensions. They may also consist of sub-contexts that group related Dimensions - e.g., a portfolio context consisting of dimensions such as commercial entity, business unit, country and asset class. For FDSF, some of these Contexts form the tabular data requests currently received by banks in spreadsheet form
- Measures consist largely of the data items one wishes to quantify, such as drawn balances, though one could also employ descriptive measures;
- Dimensions are data characteristics one may wish to group a measure or measures by - e.g., grouping individual mortgage drawn balances (measure) by loan-to-value bands (dimension). An Explicit Dimension's possible values are defined by an Explicit Domain and a Typed Dimension's possible values are defined by a Typed Domain.
- A Domain defines the range of values a Dimension can take on. An Explicit Domain is explicitly enumerated by literal members - e.g., countries. A Typed Domain consists of an undefined number of members described by constraints on the possible values they can take - .e.g, any number between 1 and 10. Separating the definition of Domain from Dimension facilitates reuse. For example, the Domain of countries in the world may be used by Dimensions such as country of incorporation, country of exposure, etc.
- A Hierarchy puts the members of a Domain in a specific order. This is useful for semantic understanding, presentation purposes and defining logical or mathematical rules.
- A Framework is a logical grouping of Contexts typically based on a commonality such as regulatory reporting - e.g., FDSF Capital Framework, FDSF Market Risk Framework.
- Mapping Tables relate two or more Domains by providing a mapping between their members. This is useful for translation of data (e.g., mapping from company-specific industry codes to SIC codes) and defining data relations / constraints between domains.
- Documents provide a place to capture details and definitions of various other less-structured or unstructured documents that cannot be defined by the structure of this data model.
- A Data Model, in this context, is a logical grouping of all of the above model elements to provide a common semantic understanding of a topic. For example, instead of having frameworks for capital and market risk within a common data model, one could have separate data models for each.
- A Glossary consists of Terms used as reference to help clarify the definitions of any other elements in one or more Data Models.
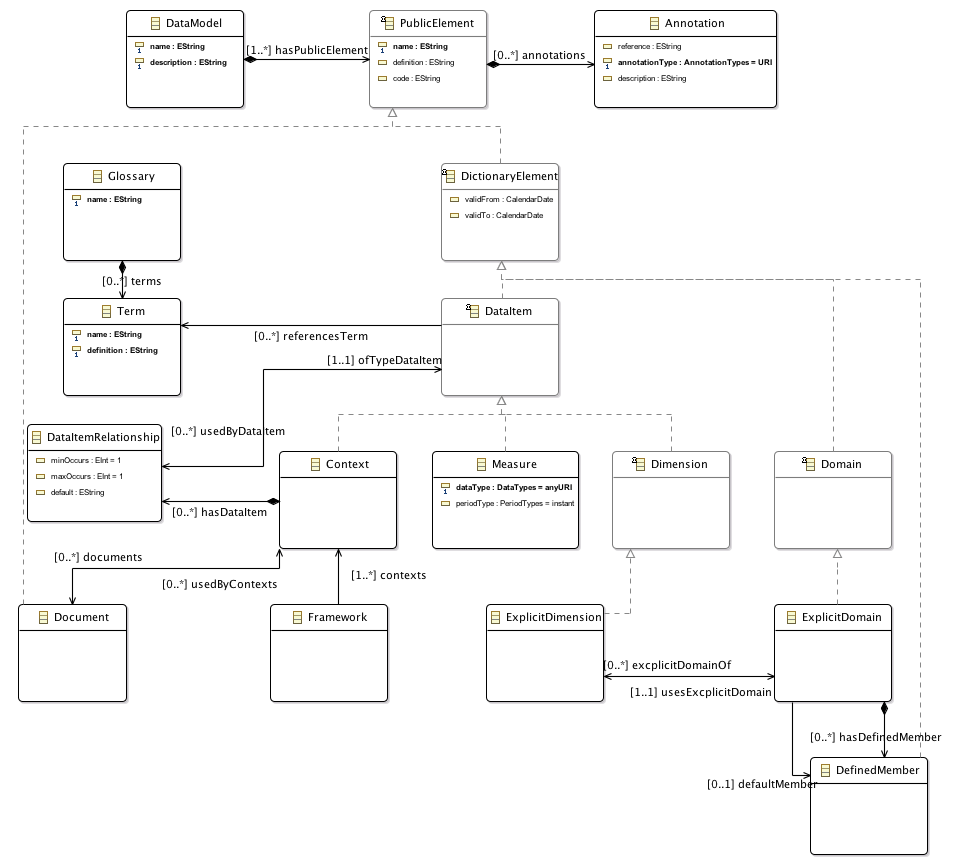 |
| Figure 2: Primary structural perspective of the data model |
Adding Data Item Relationships to a Context
As mentioned, Contexts are used to create tables of data consisting of Measures grouped by Dimensions or even other Contexts. Figure 2 shows this is done via Data Item Relationships that are contained in Contexts. This intermediary is used so that additional attributes can be added that are context-specific. For example, we can define the minimum and maximum occurrences and default value for a Data Item. These attribute values appear in exported documentation as well as constraints in generated XML schema documents.
 |
| Figure 3: Adding a model element through the right-click menu |
To add a new relationship, simply right click on the relevant Context and select Data Item Relationship from the menu. As the diagram below shows, this will open a blank form in the Form Editor where details can be entered, like which Data Item to include in the Context.
Clicking on the Link icon (represented by a chain link on the right side of figure 4) opens the Select Elements dialogue box where Data Items can be searched and selected.
The type of Data Item is indicated by icons. In figure 4 a yellow circle indicates a Measure and a yellow circle split by a cross is an Explicit Dimension.
 |
| Figure 4: Link a Data Item to a Context via a Data Item Relationship |
The icon next to the Link button (represented by a green circle containing a white cross) allows a user to create a new Data Item and link it, all at the same time.
 |
| Figure 5: Creating and linking a new Data Item |
- Context
- Measure
- Explicit Dimension
- Typed Dimension
Hierarchies and Mapping Tables
The use of hierarchies and mapping tables are depicted in figure 6. Hierarchies are an excellent way of reducing redundancies in Defined Members. Often users create Domains with overlapping sets of Defined Members due to slight changes.For example, in the banking industry, product types for retail and product types for wholesale may both include credit cards and loans. With a single Domain for product types, specialisation can still be created through separate Hierarchies for retail product types and wholesale products types, which reuse the defined members that belong to the product type Domain.
This significantly reduces the redundant Defined Members and reduces the population of Domains that need to be maintained - e.g., if a user wishes to change 'credit cards' from plural to singular, this only needs to be done once and the change will be reflected in all respective Hierarchies.
Mapping Tables enable a transition to be defined between Defined Members of different Domains. This can be used for different purposes, such as transforming data received from a source to the values expected by a target repository.
The relationships between Domains defined by a Mapping Table can also be used to constrain data. For example, one could define a mapping between asset class and product type. In banking, one may require a mortgage asset class to only take on certain product type values, such as prime, sub-prime, etc.
 |
| Figure 6: Hierarchy and Mapping Table perspective of the data model |
